PRMLの「9.3.3 Mixtures of Bernoulli distributions」で紹介されている手書き文字の分類アルゴリズムを実装してみます。
アルゴリズムの解説は下記資料の「混合分布とEM法によるクラスタリング」を参照してください。
手書き数字データの入手
MNISTの手書き数字データをダウンロードして、テキストファイルに変換します。
# wget http://yann.lecun.com/exdb/mnist/train-images-idx3-ubyte.gz
# wget http://yann.lecun.com/exdb/mnist/train-labels-idx1-ubyte.gz
# gzip -d *gz
# od -An -v -tu1 -j16 -w784 train-images-idx3-ubyte | sed 's/^ *//' | tr -s ' ' >train-images.txt
# od -An -v -tu1 -j8 -w1 train-labels-idx1-ubyte | tr -d ' ' >train-labels.txt
さらに、次のスクリプトで、「0」「3」「6」だけからなる600個のデータを抽出して、「sample-images.txt」に保存します。(サンプルとして、抽出データの先頭10文字が可読性のある形式で「samples.txt」に保存されます。)
# -*- coding: utf-8 -*-
#
# 手書き文字サンプルの抽出
#
# 2015/06/08 ver1.0
#

import re
from subprocess import Popen, PIPE

#------------#
# Parameters #
#------------#
Num = 600           # 抽出する文字数
Chars = '[036]'     # 抽出する数字(任意の個数の数字を指定可能)


labels = Popen(['zcat', 'train-labels.txt.gz'], stdout=PIPE)
images = Popen(['zcat', 'train-images.txt.gz'], stdout=PIPE)
labels_out = open('sample-labels.txt', 'w')
images_out = open('sample-images.txt', 'w')
chars = re.compile(Chars)

while True:
    label = labels.stdout.readline()
    image = images.stdout.readline()
    if (not image) or (not label):
        break
    if not chars.search(label):
        continue

    line = ''
    for c in image.split(" "):
        if int(c) > 127:
            line += '1,'
        else:
            line += '0,'
    line = line[:-1]
    labels_out.write(label)
    images_out.write(line + '\n')
    Num -= 1
    if Num == 0:
        break

labels_out.close()
images_out.close()

# drains remaining data
labels.stdout.readlines()
images.stdout.readlines()
labels = images = None

images = open('sample-images.txt', 'r')
samples = open('samples.txt', 'w')
c = 0

while True:
    line = images.readline()
    if not line:
        break
    x = 0
    for s in line.split(','):
        if int(s) == 1:
            samples.write('#')
        else:
            samples.write(' ')
        x += 1
        if x % 28 == 0:
            samples.write('\n')
    c += 1
    if c == 10:
        break

images.close()
samples.close()
これで抽出されたデータファイル「sample-images.txt」をトレーニングセットとして利用します。
EM法の実行
次のコードで実行します。
# -*- coding: utf-8 -*-
#
# 混合ベルヌーイ分布による手書き文字分類
#
# 2015/04/24 ver1.0
#

import numpy as np
import matplotlib.pyplot as plt
import pandas as pd
from pandas import Series, DataFrame
from numpy.random import randint, rand

#------------#
# Parameters #
#------------#
K = 3   # 分類する文字数
N = 10  # 反復回数


# 分類結果の表示
def show_figure(mu, cls):
    fig = plt.figure()
    for c in range(K):
        subplot = fig.add_subplot(K,7,c*7+1)
        subplot.set_xticks([])
        subplot.set_yticks([])
        subplot.set_title('Master')
        subplot.imshow(mu[c].reshape(28,28), cmap=plt.cm.gray_r)
        i = 1
        for j in range(len(cls)):
            if cls[j] == c:
                subplot = fig.add_subplot(K,7,c*7+i+1)
                subplot.set_xticks([])
                subplot.set_yticks([])
                subplot.imshow(df.ix[j].reshape(28,28), cmap=plt.cm.gray_r)
                i += 1
                if i > 6:
                    break
    fig.show()

# ベルヌーイ分布
def bern(x, mu):
    r = 1.0
    for x_i, mu_i in zip(x, mu):
        if x_i == 1:
            r *= mu_i
        else:
            r *= (1.0 - mu_i)
    return r

# Main
if __name__ == '__main__':
    # トレーニングセットの読み込み
    df = pd.read_csv('sample-images.txt', sep=",", header=None)
    data_num = len(df)

    # 初期パラメータの設定
    mix = [1.0/K] * K
    mu = (rand(28*28*K)*0.5+0.25).reshape(K, 28*28)
    for k in range(K):
        mu[k] /= mu[k].sum()

    # N回のIterationを実施
    fig = plt.figure()
    for iter_num in range(N):
        print "iter_num %d" % iter_num

        # E phase
        resp = DataFrame()
        for index, line in df.iterrows():
            tmp = []
            for k in range(K):
                a = mix[k] * bern(line, mu[k])
                if a == 0:
                    tmp.append(0.0)
                else:
                    s = 0.0
                    for kk in range(K):
                        s += mix[kk] * bern(line, mu[kk])
                    tmp.append(a/s)
            resp = resp.append([tmp], ignore_index=True)

        # M phase
        for k in range(K):
            nk = resp[k].sum()
            mix[k] = nk/data_num
            for index, line in df.iterrows():
                mu[k] += line * resp[k][index]
            mu[k] /= nk

            subplot = fig.add_subplot(K, N, k*N + iter_num + 1)
            subplot.set_xticks([])
            subplot.set_yticks([])
            subplot.imshow(mu[k].reshape(28,28), cmap=plt.cm.gray_r)
    fig.show()

    # トレーニングセットの文字を分類
    cls = []
    for index, line in resp.iterrows():
        cls.append(np.argmax(line[0:]))

    # 分類結果の表示
    show_figure(mu, cls)
実行結果
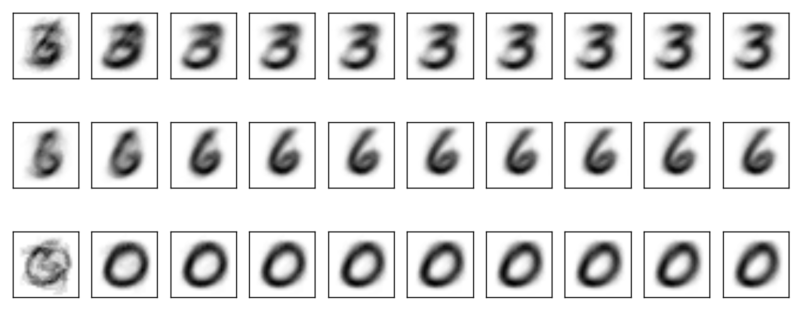
まず、10回のIterationで、混合分布の3つの分布要素がどのように変化したかを示します。
左から右に、Iterationによって、「0」「3」「6」の要素が抽出されていることが分かります。
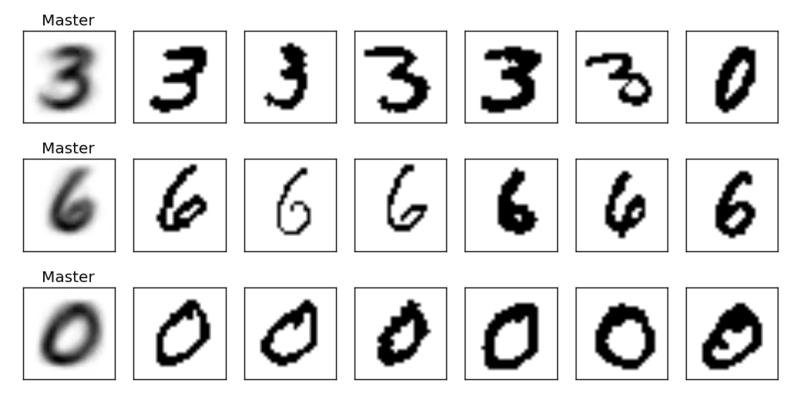
次は、それぞれの要素に分類されるデータのサンプルです。
一番左の「Master」は抽出された分布で、その右にサンプルが並びます。この例では右上の「0」が誤って分類されていますが、これは、字の幅が細いために、左下の「Master」にうまくマッチしていないためと想像されます。このモデルでは、あくまでビットマップの各要素を個別に見ており、「線のつながり」のような相関が考慮されないので、このような事が起こります。
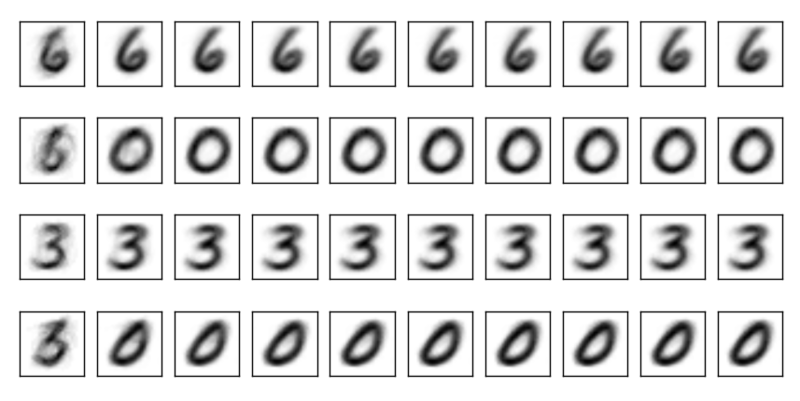
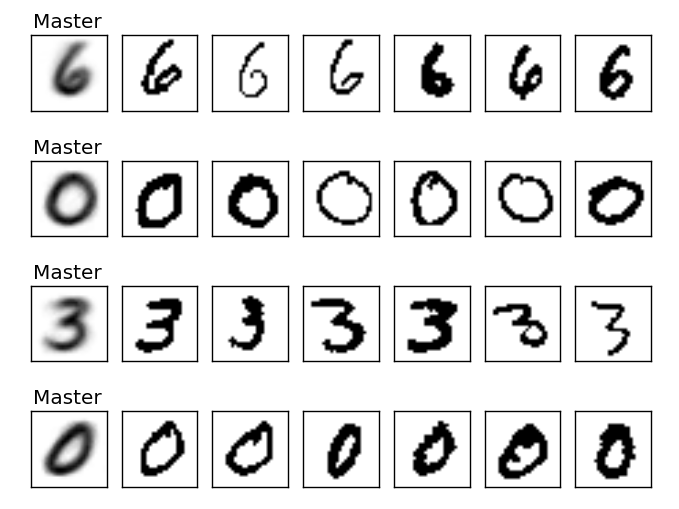
そこで、同じトレーニングセットを4種類の分布の混合として分類してみます。先ほどのコードで、冒頭の「K=3」を「K=4」に変更して実行すると、次の結果が得られます。
なんと!
「真円に近い0」と「縦長の0」がきれいに分離されています。つまり、世の中の手描きの「0」は、「真円に近い0」と「縦長の0」の2種類に分類されるということが判明しました。
また、「3」の「Master」をよく見ると、こちらにも違いが現れています。「K=3」の結果では、縦長の0が混じった影響で、左側にうっすらとした縦線がありましたが、「K=4」の方ではそれがなくなって、より純粋な「3」が分離されていることが分かります。


