やる事
(x, y) 平面上のデータをロジスティクス回帰で二項分類します。
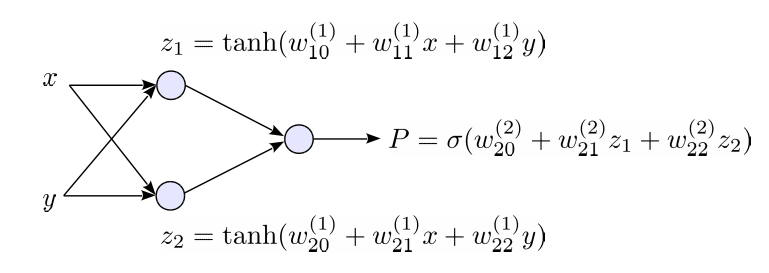
回帰式として、中間層に2個のユニットを持つ下記のNeural Networkを使用します。バイアス項を含めて、9個のパラメーター を持つ関数になります。
次の誤差関数を極小にするように、Back Propagationでパラメーターを最適化します。(最尤推定に相当します。)
PRMLのFigure 5.4に相当する処理になります。
これをPythonでベタに実装すると次のコードになります。
# -*- coding: utf-8 -*-

import numpy as np
import matplotlib.pyplot as plt
import pandas as pd
from pandas import Series, DataFrame
from numpy.random import multivariate_normal, rand

N1 = 10
Mu1 = [40,10]
N2 = 10
Mu2 = [10,-10]
N3 = 15
Mu3 = [5,8]

def sigmoid(a):
    return 1.0/(1.0+np.exp(-a))

def prepare_dataset():
    cov1 = np.array([[30,0],[0,80]])
    cov2 = np.array([[80,0],[0,10]])
    cov3 = np.array([[60,0],[0,20]])

    df1 = DataFrame(multivariate_normal(Mu1,cov1,N1),columns=['x','y'])
    df1['type'] = 1
    df2 = DataFrame(multivariate_normal(Mu2,cov2,N2),columns=['x','y'])
    df2['type'] = 1
    df3 = DataFrame(multivariate_normal(Mu3,cov3,N3),columns=['x','y'])
    df3['type'] = 0

    df = pd.concat([df1,df2,df3],ignore_index=True)
    df = df.reindex(np.random.permutation(df.index)).reset_index()
    return df[['x','y','type']]

def run_simulation(tset, M, subplot1, subplot2):
    tset1 = tset[tset['type']==1]
    tset2 = tset[tset['type']==0]
    ymin, ymax = tset.y.min()-5, tset.y.max()+10
    xmin, xmax = tset.x.min()-5, tset.x.max()+10

    bias = 0.5 * (tset.x.mean() + tset.y.mean())
    w = {}

    def f(x,y):
        a = [0.0]*M
        z = [0.0]*M
        for j in range(1,M):
            a[j] = w[(1,(j,0))]*bias + w[(1,(j,1))]*x + w[(1,(j,2))]*y
            z[j] = np.tanh(a[j])
        a_k = w[(2,(1,0))]*1.0
        for j in range(1,M):
            a_k += w[(2,(1,j))]*z[j]
        return a_k, a

    def initval():
        return rand()-0.5

    w[(2,(1,0))]=initval()
    for j in range(1,M):
        w[(1,(j,0))] = initval()
        w[(1,(j,1))] = initval()
        w[(1,(j,2))] = initval()
        w[(2,(1,j))] = initval()

    eta = 0.05
    err_pre = 10000
    for iter_num in range(1000):
        for index, point in tset.iterrows():
            x, y, type = point.x, point.y, point.type
            a_k, a = f(x,y)
            d_k = sigmoid(a_k) - type
            w[(2,(1,0))] -= eta * d_k * 1
            d = [0] * M
            for j in range(1,M):
                d[j] = d_k*w[(2,(1,j))]*(1.0-np.tanh(a[j])*np.tanh(a[j]))
                w[(1,(j,0))] -= eta * d[j] * bias
                w[(1,(j,1))] -= eta * d[j] * x
                w[(1,(j,2))] -= eta * d[j] * y
                w[(2,(1,j))] -= eta * d_k * np.tanh(a[j])
        err = 0
        for index, point in tset.iterrows():
            x, y, type = point.x, point.y, point.type
            a_k, a = f(x,y)
            p = sigmoid(a_k)
            err += -(type*np.log(p)+(1-type)*np.log(1.0-p))
        if np.abs(err_pre - err) < err_pre * 0.00001:
            print "break"
            break
        err_pre = err

    print err_pre
    RES = 80
    X = np.linspace(xmin,xmax,RES)
    Y = np.linspace(ymin,ymax,RES)
    field1 = DataFrame(np.zeros(shape=(len(X),len(Y))))
    field2 = DataFrame(np.zeros(shape=(len(X),len(Y))))
    for x, xval in enumerate(X):
        for y, yval in enumerate(Y):
            a_k, a = f(xval,yval)
            field1.ix[y,x] = np.sign(sigmoid(a_k)-0.5)
            field2.ix[y,x] = sigmoid(a_k)

    subplot1.set_title('M=%d, Err=%1.2f' % (M-1, err_pre))
    subplot1.set_xticks([])
    subplot1.set_yticks([])
    subplot1.set_ylim([ymin-1, ymax+1])
    subplot1.set_xlim([xmin-1, xmax+1])
    subplot1.scatter(tset1.x, tset1.y, marker='o')
    subplot1.scatter(tset2.x, tset2.y, marker='x')
    subplot1.imshow(field1.values, extent=(xmin,xmax,ymax,ymin),
        alpha=0.4)

    subplot2.set_title('M=%d, Err=%1.2f' % (M-1, err_pre))
    subplot2.set_xticks([])
    subplot2.set_yticks([])
    subplot2.set_ylim([ymin-1, ymax+1])
    subplot2.set_xlim([xmin-1, xmax+1])
    subplot2.scatter(tset1.x, tset1.y, marker='o')
    subplot2.scatter(tset2.x, tset2.y, marker='x')
    subplot2.imshow(field2.values, extent=(xmin,xmax,ymax,ymin),
        alpha=0.4, vmin=0, vmax=1, cmap=plt.cm.gray_r)

# Main
if __name__ == '__main__':
    fig = plt.figure()
    tset = prepare_dataset()
    for i in range(4):
        subplot1 = fig.add_subplot(2,4,i+1)
        subplot2 = fig.add_subplot(2,4,i+1+4)
        run_simulation(tset, 3, subplot1, subplot2)
    fig.show()
実行結果
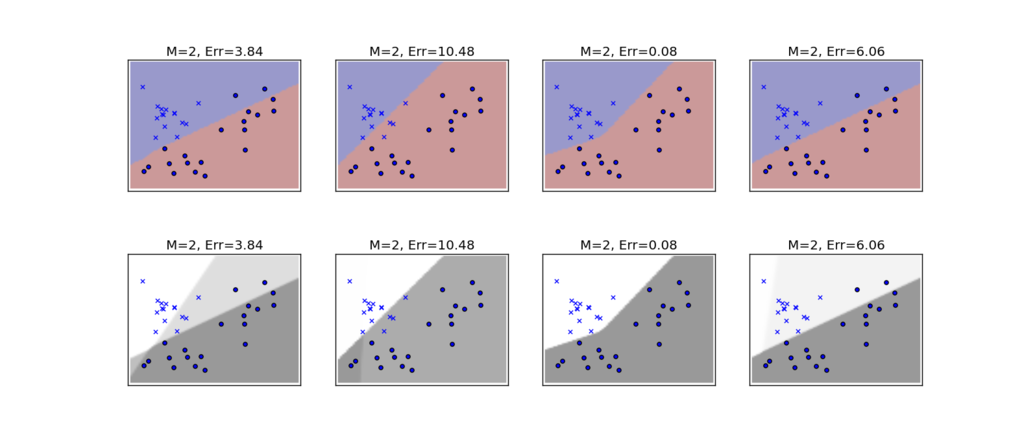
Neural Networkは、極所解(極小点)が多いので、結果が初期値に大きく依存します。このコードでは、ランダムな4種類の初期値を使って、4種類の解を求めています。
上段は、 の境界線を示したもので、下段は、確率
の値を濃淡で示したものになります。
この中で一番良い結果を与えているのは、左から3番目の結果になります。
一方、一番左の例では、下段の濃淡を見ると、大きく4種類の確率の領域に分割されていることが分かります。これは、中間層のユニットが2個あることから理解できます。それぞれの中間層は、平面を直線で2つの領域に分類しており、それぞれの分類の組み合わせが出力層への入力になるので、結果として、4種類の組み合わせが出力層に入ります。

